
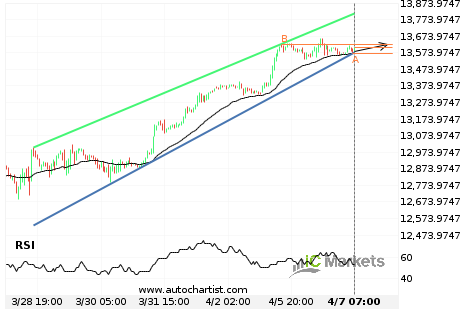
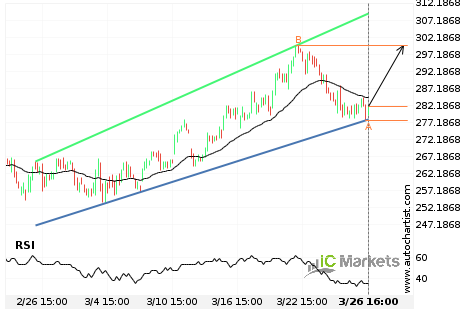
Either a rebound or a breakout imminent on US Tech 100 Index
US Tech 100 Index is heading towards the resistance line of a Channel Up. If this movement continues, we expect the price of US Tech 100 Index to test 13626.0000 within the next 3 days. But don’t be so quick to trade, it has tested this line numerous times in the past, so this movement […]
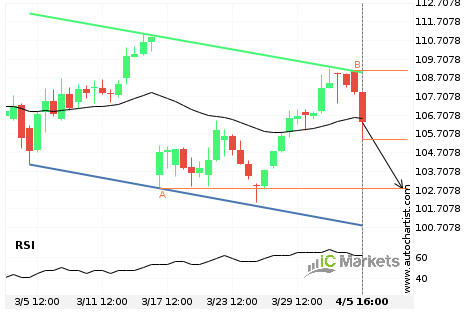
Will AbbVie have enough momentum to break support?
AbbVie is heading towards the support line of a Channel Down and could reach this point within the next 3 days. It has tested this line numerous times in the past, and this time could be no different from the past, ending in a rebound instead of a breakout. If the breakout doesn’t happen, we […]
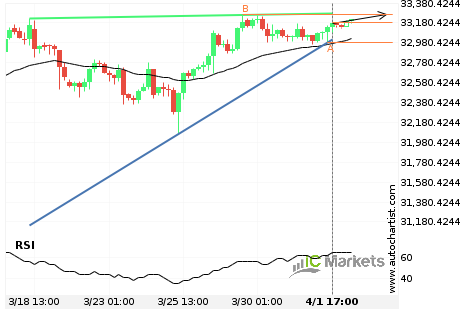
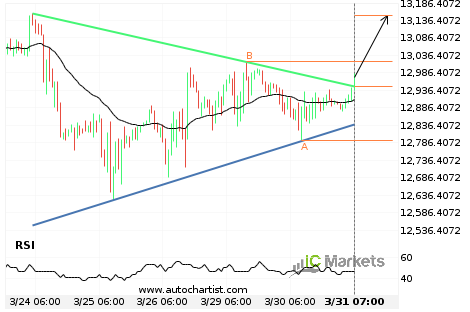
Either a rebound or a breakout imminent on US Wall Street 30 Index
US Wall Street 30 Index is heading towards the resistance line of a Ascending Triangle. If this movement continues, we expect the price of US Wall Street 30 Index to test 33260.0000 within the next 3 days. But don’t be so quick to trade, it has tested this line numerous times in the past, so […]
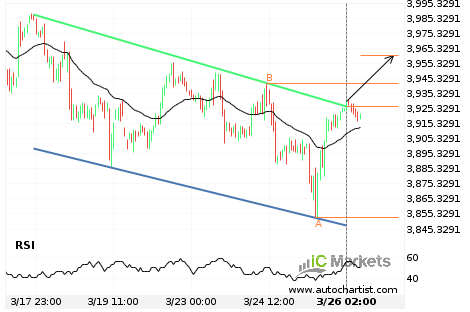
US Tech 100 Index has broken through resistance
US Tech 100 Index has broken through the resistance line of a Channel Down. It has touched this line at least twice in the last 14 days. This breakout indicates a potential move to 13399.7878 within the next 3 days. Because we have seen it retrace from this positions in the past, one should wait […]
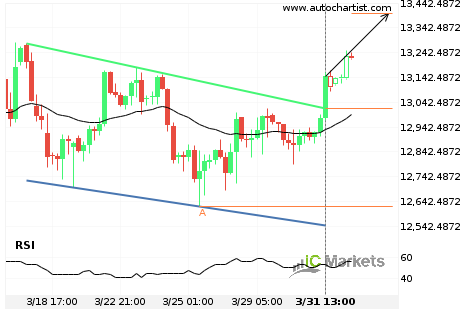
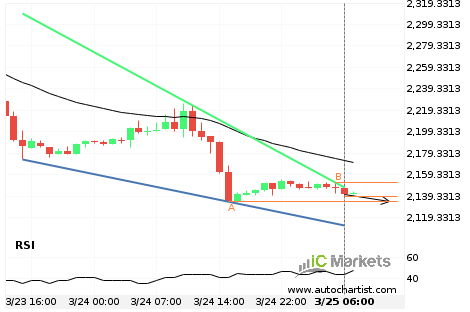
US Tech 100 Index has broken through resistance
US Tech 100 Index has broken through the resistance line of a Triangle. It has touched this line at least twice in the last 8 days. This breakout indicates a potential move to 13151.3726 within the next 2 days. Because we have seen it retrace from this positions in the past, one should wait for […]

Either a rebound or a breakout imminent on US Tech 100 Index
US Tech 100 Index is heading towards the support line of a Falling Wedge. If this movement continues, we expect the price of US Tech 100 Index to test 12622.2000 within the next 2 days. But don’t be so quick to trade, it has tested this line numerous times in the past, so this movement […]
FACEBOOK approaching resistance of a Channel Up
FACEBOOK is approaching the resistance line of a Channel Up. It has touched this line numerous times in the last 29 days. If it tests this line again, it should do so in the next 2 days.
A start of a bullish trend on US SPX 500 Index
US SPX 500 Index has broken through a resistance line of a Channel Down chart pattern. If this breakout holds true, we expect the price of US SPX 500 Index to test 3960.4769 within the next 2 days. But don’t be so quick to trade, it has tested this line in the past, so you […]
Should we expect a breakout or a rebound on US Small Cap 2000 Index?
The movement of US Small Cap 2000 Index towards the support line of a Falling Wedge is yet another test of the line it reached numerous times in the past. We expect this line test to happen in the next 10 hours, but it is uncertain whether it will result in a breakout through this […]
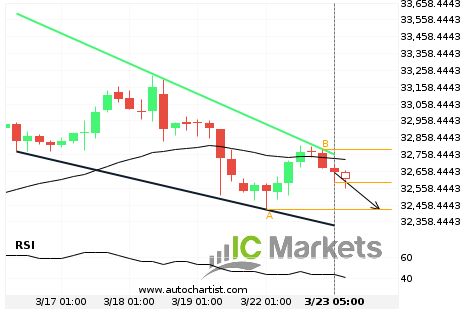
Should we expect a breakout or a rebound on US Wall Street 30 Index?
The movement of US Wall Street 30 Index towards the support line of a Falling Wedge is yet another test of the line it reached numerous times in the past. We expect this line test to happen in the next 2 days, but it is uncertain whether it will result in a breakout through this […]